The Graphs tab shows how hard the whole server is working: live every 10 seconds, or averages for the last hour, 12 hours, 24 hours, week or 30 days.
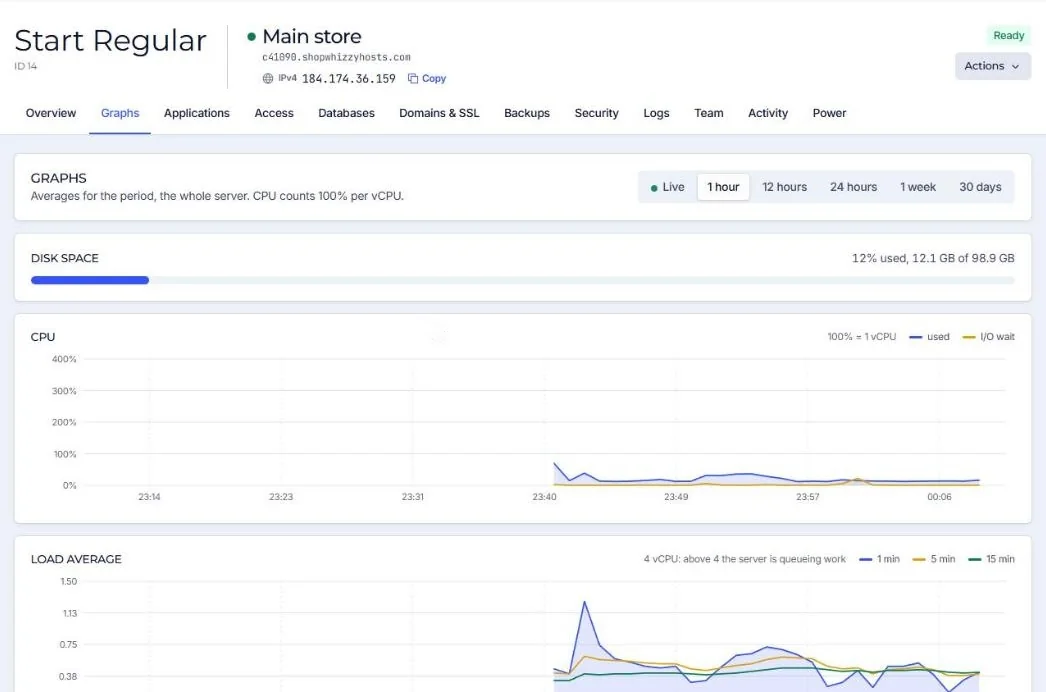
The graphs
| Graph | What it shows | When to worry |
|---|---|---|
| Disk space | How full the disk is. | Above 80%: clean up or plan more space. Above 90% things start to fail. |
| CPU | CPU in use, where 100% is one full vCPU (a 4 vCPU server goes to 400%), plus I/O wait. | Close to the maximum for long periods, or high I/O wait. |
| Load average | Work waiting for the CPU over 1, 5 and 15 minutes. | The 15-minute line above the number of vCPUs: the server is queueing work. |
| Memory | Memory in use and swap. | Swap growing steadily, or memory always at the top. |
| Disk throughput and IOPS | How much is read and written per second. | Long write peaks at night are usually backups or reindexing, which is normal. |
| Network traffic and packets | Data and packets in and out. | Sudden incoming peaks with high CPU: often bots or an attack. |
Live and history
Live shows the last 10 minutes and updates itself every 10 seconds: use it while you test a change or watch a sale. The other periods are averages per minute up to per two hours, so short peaks are smoothed out; the CPU graph keeps the peaks of each minute.
Patterns we see often
Usually cron jobs, reindexing or an import. Check the times against your scheduled tasks.
Crawlers or bots. Look at the Traffic tab and the Protection tab.
Too many PHP workers for the memory, or a memory leak. See Out of memory.
The disk is the bottleneck: large imports, backups, or a database that needs more memory.
The graphs come from a small collector on the server that keeps 31 days of history. If a graph says the collector is not running, open a ticket.
Did this solve it? If not, tell us what you see and we look at your server.
Open a ticket